Packers
I’ve been analyzing a malware sample lately, and of course, it was packed. That’s why I wanted to write this article before diving deeper into that specific malware. But enough talk, let’s get to the actual case.
Before jumping into packers and related topics, let’s talk more about the PE (Portable Executable) file format. Yes, I know I wrote a “PE Overview Part 1,” and I haven’t started the second part yet after all. I wish to make it a bit more practical than theoretical.
PE File short overview
The PE File itself can be thought of as split into two parts: Headers and Sections. Oh, I didn’t even mention their purpose yet, did I? Let me fix that.
The PE File format defines the structure of the binary code that will be executed by the operating system.
The PE Headers contain all the information the operating system needs to execute the program. This includes details like which DLLs to load, which portions of the file are executable code, which parts are data, the starting point of execution, and whether the program is a GUI application, a console application, or something else.
And sections… well, they are the sections.
As I recall, my teacher once asked, “What is the meaning of ‘space’ vectors?” and there was an answer: “It’s related to space.”
Okay, so now you know a little bit about PE files. But what about packers?
In simple terms, a packer is a tool that takes an executable file and transforms it into a new one.
This new file functions the same way as the original but looks different in terms of size, structure, or how it’s stored on the operating system.

In some ways, packers are pretty close to obfuscation, though they serve slightly different purposes.
One of the main reasons packers were created was to reduce the size of an executable by compressing its data and decompressing it in real time during execution. These types of packers are known as compressors.
Another term you might come across is “protector”. The primary purpose of a protector is to safeguard the original executable, making reverse engineering extremely difficult. And yes, it’s as challenging as it sounds(sometimes).
Now, I’m not going to dive into malware just yet or how attackers exploit every possible vulnerability. But one key aspect of how antivirus (AV) software works is through signatures. Signatures are a critical part of any AV engine. These signatures can be hashes or byte-streams that are used to determine whether a file or buffer contains a malicious payload. By packing the malware, the attacker may be lucky and he may make the malware undetectable by the AV software.
One of the most common features among packers or at least something they all share is the need to introduce additional code into the original executable. This code is used to “undo” the changes made to the file’s structure or footprint on the file system. This additional code is known as the packer stub.
The packer stub is usually executed at the very beginning of the packed file’s runtime.

Okay my coffee is ready, let’s move further.
I’m not going to talk how a packer is made tho [besides of the idea that i have some little idea of how is it made and i’m interested in making one but this isn’t the topic of our thing].
The stub must be independent, meaning it doesn’t rely on Windows PE structures to run. It’s somewhat similar to the concept of shellcode, but there are differences between x86 and x64 assembly. Another approach is to use Reflective DLL Injection, where the code is injected into a static region of memory and executed directly.
Now one of the things we could take a look to say (not 100%) or at least a better way to put it in words to lead ourself if the software is packed or not:
- strings -> these are critical part of any program because they are used to pass the arguemnt to a function and moslty easy to detect. I mean we can see function’s name and even the parameters.
- Imports -> Quite important as the software need them and we can understand how does the program interacts with the OS. Actually i wanted to use here an image but i didn’t find a packed malware (i mean .data or .rsrc isn’t really relevant here, still important tho)
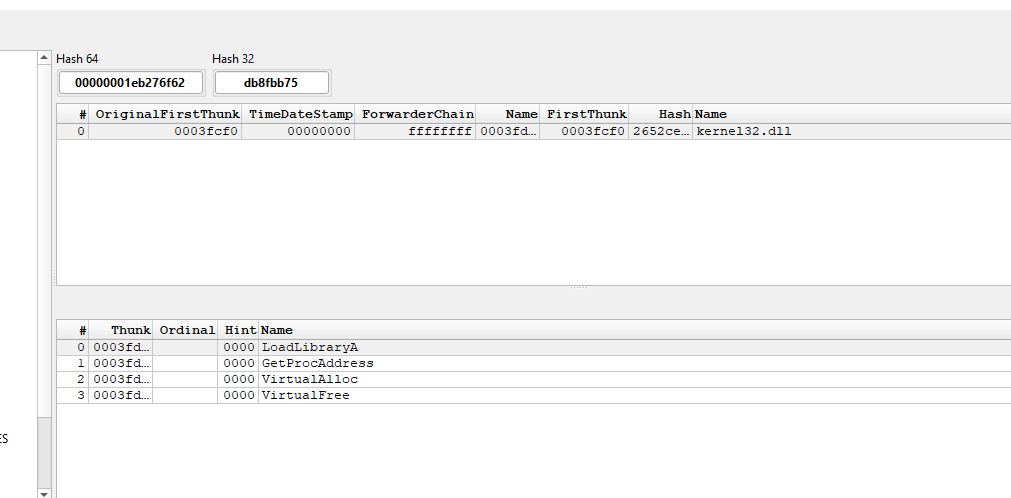
As I mentioned earlier ( The power of Coffee), when malware is packed, particularly the .text section, the number of imports will decrease drastically, as you can see here.
- These are essential for understanding more about the software. Some of the most common and well-known sections include
.text,.data,.rsrc, and.reloc. Yeah, it’s too much for me to remember, kidding.
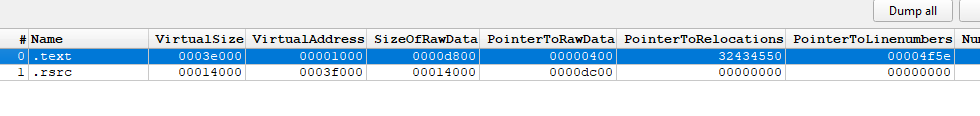
Even if I’m analyzing the same malware (not the one I’m currently working on I can’t define its type yet, though I actually know what it is, but let’s keep that a secret for now [It’s possible that this could be a **RAT ** or a stealer, but I can’t say for sure at this point. The malware uses a lot of cryptographic methods, and honestly, it’s giving me a headache trying to analyze it.] ), you might notice that only the
.textand.rsrcsections are present, which is somewhat suspicious.
-
You might notice that only the
.textand.rsrcsections are present, which is somewhat suspicious. -
Entropy -> You might ask, “What’s entropy?” I’m not going to define it here, but if you have some time, I highly recommend reading Practical Malware Analysis by Michael Sikorski and Andrew Honig. It’s an excellent book.
Entropy is a measure of the disorder in a system or program, and while there is not a well-defined standard mathematical formula for calculating entropy, there are many well-formed measures of entropy for digital data. Compressed or encrypted data more closely resembles random data, and therefore has high entropy; executables that are not encrypted or compressed have lower entropy
- Signature -> A file signature is a sequence of bytes or a specific pattern within a file that helps identify its type. In our context, these signatures can take the form of hashes, specific byte sequences, or behavioral signatures.
At this point, I’ve probably given you a basic idea of how a packer works.
Anti-Unpack Techniques
There isn’t a lot to talk about packers on surface as the plan isnt to write one , at least for now . I wish to talk about anti-unpack techniques that they use, i’m not going to cover all of them i will start from basic to medium.
IsDebuggerPresent()
Known as the most basic debugger detection , but still used that involves checking the BEingDebugged flag that’s found inside PEB.
call [IsDebuggerPresent]
test eax, eax
jnz debugged
Or checking the flag directly
mov eax, dword[fs:0x30]    ;TEB -> PEB
movzx eax, byte [eax+0x20]  ;AL -> PEB-BeingDebugged
test eax, eax ;
jnz debugged
It’s pretty basic to patch it, so i’m not going to stop here.
PEB.NtGlobalFlag

Now PEB, besides BeingDebugged has another field called NtGlobalFlag (0x68 for x86 and 0xBC for x86_64 ) which packers also use to detect if the program has been loaded by a debugger. Now the idea is that if you’re going to attach a debugger the value will be 0. However if you’re going to run the process within x32dbg or any other debuggign tool lke Olly the flags will be set:
- FLG_HEAP_ENABLE_TAIL_CHECK (0x10)
- FLG_HEAP_ENABLE_FREE_CHECK (0x20)
- FLG_HEAP_VALIDATE_PARAMETERS (0x40)
I’m going to leave a reference link at the end of the blog related to anti-debug tricks talking about each of them is a lot and time-consuming the point is just to give a proper idea of how they try to protect the malware that is packed in order for not being able to unpack it.
In order to patch NtGlobalFlag you need to set the value to 0.
var patch_address
var peb
var p_heap

;get the address of the PEB
mov peb, fs:[7ffde000+30] ; hardcoded TEB address + 30 - PEB offset

//patch the NtGlobalFlag
mov patch_address, [peb+68] ; PEB->NtGlobalFlag
mov [patch_address], 0

;if you're going to read about HeapFlags and i recommend you to do so

mov p_heap, [peb+18]
lea patch_address, [p_heap + 0C]
mov [patch_address], 2
lea patch_address, [p_heap + 10]
mov [patch_address], 0
Timing Checks

When a process is being debugged, several CPU cycles are spent on debugger event handling code. Packers can take advantage of this by measuring the time spent between instructions. If the time taken is longer than normal, it likely means the process is being executed under a debugger.
One solution to this problem is to identify where the timing checks are located and avoid stepping through the code between these checks. For example, a breakpoint can be set on GetTickCount() to determine where it is called or to modify its return value.
There is another, more advanced method related to OllyDbg. This method involves installing a kernel-mode driver to handle the timing checks. However, working at the kernel level carries a risk of system instability. That said, this isn’t a major concern if you’re running the debugger in a VM.
Software Breakpoint Detection [SBD]
Software breakpoints (SB) are set by modifying the code at the target address, replacing it with a byte value of 0xCC, also known as INT 3. Packers identify software breakpoints by scanning for this byte in the protected code and potentially in the API code.
cld
mov    edi, Protected_Code_Start
mov    ecx, Protected_Code_End - Protected_Code_Start
mov    al, 0xcc
repne  scasb
jz     .breakpoint_found
cld clears the Direction Flag (DF) in the EFLAGS register.
mov edi, Protected_Code_Start loads the starting address of the protected code into the EDI register.
mov ecx, Protected_Code_End - Protected_Code_Start calculates the length of the code block (from Protected_Code_Start to Protected_Code_End) and stores it in the ECX register.
mov al, 0xcc is a basic instruction that loads the value 0xCC into the AL register.
repne scasb:
-
repne: Repeats the following instruction (scasb) while the Zero Flag (ZF) is not set (ZF = 0) andECXis not zero. -
scasb: Compares the byte at the memory location pointed to byEDIwith the value inAL(0xCC). If they match, the Zero Flag (ZF) is set (ZF = 1), andEDIis incremented (due tocld).
This loop scans the memory range (Protected_Code_Start to Protected_Code_End) for the presence of 0xCC (breakpoints).
In summary:
- It scans the memory range between
Protected_Code_StartandProtected_Code_Endfor the presence of the0xCCbyte (INT 3 breakpoint instruction).
Solution: You could use hardware breakpoints instead.
Hardware Breakpoint Detected [HBD]
Since Software Breakpoints (SBD) aren’t always sufficient for us , Hardware Breakpoints (HBD) come into play. These breakpoints are set by configuring the debug registers (Dr0 to Dr7). Specifically:
-
Dr0toDr3contain the addresses of up to 4 breakpoints. -
Dr6identifies which breakpoint has been triggered. -
Dr7contains flags to control the 4 hardware breakpoints, such as enabling/disabling them or specifying whether to break on read, write, or execute operations.
Detecting hardware breakpoints requires some code and a bit of knowledge, as the debug registers are not accessible in Ring 3. If you’re unfamiliar with what Ring 3 means, one of my teachers once told me:
“Google it!” [Pretty good answer ]
It’s related to kernel and permission levels.
I’ll also briefly mention a few more techniques:
- Blocking Input
- TLS Callbacks
- Misdirection
- ThreadHide
—
TLS Callbacks[TLSC]
This is another technique used by packers to execute code before the actual Entry Point (EP) is reached. In simple terms, it runs a block of code before the main function (and I’m dealing with this right now).
TLS (Thread Local Storage) is a feature in Windows that allows threads to allocate storage for thread-specific data. You can learn more about it here: Thread Local Storage (Microsoft Docs). Packers often use TLS callbacks to perform debugger detection and decryption routines before the main program execution begins. So, it’s good to be aware of this technique.
I feel like an old guy right now, like I’m reading those books where they abbreviate everything. For example, “Long Name” becomes “LN.” I totally get that feeling now.
TLS Callbacks (TLSC) can be identified using PE file parsing tools. These tools will show whether a TLS directory exists in the Data Directory entries of the PE file.
Data Directory:
...
TLS rva: value size: value
...
Then the actual content of the TLS directory is displayed., which will look something like this:
TLS Directory:
StartAddressOfRawData: ....
EndAddressOfRawData: ....
AddressOfIndex: ...
AddressOfCallBacks: ...
SizeOfZeroFill: ....
Charactersitics: ....
Since TLSC are called before the actual EP, the debugger should be configures so that it will break the actual loader and before the TSLC are called. NTDLL->LdrpRunInitializeRoutines() executes these TLSC. Once set, breakpoints can be set on the callback routines and then traced.
Blocking Input
As the name says it will block the input. To prevent a reverser from controling the debugger, a nice guy called packer can use User32 -> BlockInput() to block keyboard and mouse input while the main unpacking routine is being executed, pretty Nice right?
Hidden withing garbage codes and anti-dissasembly codes techniques [i’m not sure if i will talk about them in my future low level (quality) posts], this can be effective. If executed the system will appear to be unresponsive, leaving the reverses baffled.
As just as a basic imagination:
...
push 1
call [BlackInput]

unpacking...

push 0
call [BlockInput]
To be honest isn’t hard to patch, you need to perform a RETN.
gpa "BlockInput", "user32.dll"
mov [$RESULT], #C20400#
Explanation in the Context of OllyScript:
-
gpa "BlockInput", "user32.dll":- In OllyScript,
gpais a command that resolves the address of an exported function (likeBlockInput) from a specified DLL (in this case,user32.dll).
- In OllyScript,
-
mov [$RESULT], #C20400#:[$RESULT]refers to the memory location or variable where the result of thegpacommand is stored.
It can be done in x32dbg but i’m not really a fan of python so, I’m sorry.
ThreadHideFromDebugger
This technique uses ntdll>>NtSetInformationThread(), which is typically used for setting a thread’s priority. However, it can also be used to prevent debugging events from being sent to the debugger.
__kernel_entry NTSYSCALLAPI NTSTATUS NtSetInformationThread(
  [in] HANDLE          ThreadHandle,
  [in] THREADINFOCLASS ThreadInformationClass,
  [in] PVOID           ThreadInformation,
  [in] ULONG           ThreadInformationLength
);
In order to achieve ThreadHideFromDebugger, the value 0x11 is passed as the ThreadInformationClass parameter, and the ThreadHandle is usually set to the current thread handle.
What can you do to stop this? Well, you can set a breakpoint on the API call, and once it’s hit, you could manipulate the EIP (Instruction Pointer) to prevent the API call from reaching the kernel. Besides that, OllyDbg has the option to patch the call directly. I haven’t used the built-in options in OllyDbg or x32dbg much. I mostly try to patch them manually to keep an eye on what I remember and what I don’t.
Misdirection and Stopping Execution via Exceptions
For now, this will be the last technique I’ll briefly explain. I’ll dive deeper into the malware itself if necessary. I’ve analyzed a few malware samples so far, and I’ve noticed that some of them repeat certain patterns, while others don’t even use packers or any anti-debugging techniques at all. However, that doesn’t mean we should stop exploring the techniques they do use, or might use in the future.
What is the Whole Idea Behind This?
Normally, when we trace through code in a linear manner, it provides a smooth and easy-to-follow experience, making it simpler to understand the code. However, in some cases, this technique doesn’t align with the concept of a “balancer.”
Packers often use exceptions as part of their unpacking process. By throwing caught exceptions, they disrupt the linear flow of execution. As a reverse engineer, you need to understand:
-
Where the EIP (Instruction Pointer) will point to when the exception occurs.
-
Where the EIP will point after the exception handler has executed.
Additionally, exceptions are a way for packers to repeatedly pause the execution of the unpacking code. When exceptions are thrown and the process is under a debugger, the debugger will stop the execution of the unpacking code—sometimes even temporarily.
What Can You Do?
You can configure OllyDbg (or other debuggers) to automatically pass exceptions to their respective handlers. This allows the unpacking process to continue without manual intervention.
Some of the most common exceptions you’ll encounter are:
-
Access Violation
-
Breakpoint
-
Single Step
With all that said, I tried to “overview” this topic as I hit my head against it.