Another day of college, another day of hell—I mean, a beautiful day to write a blog! :) Now, I may not know much about the ’90s, but for sure, nowadays people use mechanisms to defend their software against reverse engineering. However, that doesn’t mean they’re safe. Don’t take me wrong, but if you have a house made out of sticks, it will break easily. Therefore, there are higher and more complex mechanisms to defend themselves from the same branch. Yeah, I’m talking about anti-debugging, even though real-time debugging is so helpful. Signed by Cringe Blogger (i mean me )
What is Anti-Debugging?
So let’s stop the chitchat and get to the main point: what is this thing called anti-debugging? The name speaks for itself — anti + debugging, meaning “no debugging.” To achieve this, we use various anti-debugging techniques. This term refers to methods a program can use to detect if it is running under the control of a debugger (e.g., attach + exe [x32dbg]).
What is Debugging?
Stop asking too many questions!
Debugging software lets you run the program step by step, checking each instruction as it goes. This helps you see how the program uses the stack, heap, and registers, and how memory and settings change during runtime. You can follow function calls, track data flow, and find potential weaknesses or hidden features in the program. In short, debugging gives you a peek into the program’s inner workings, helping you understand its logic, find flaws, or reverse-engineer its functionality.
In the end, anti-debugging is meant to ensure that a program isn’t running under a debugger. But still, it’s better to have a house made of stones than one made of sticks. It holds the damage better. :)

Debug flags
Let’s not rush directly to the implementation or bypass, let’s talk about debug flags too (I mean, it’s a part of anti-debugging, right?). Now of course we dont have a flag here but something like an indicator used to detect the presence of a debugger. It’s a special type of flag that is used to signal whether a program is being “analyzed” by a debugger. #debuger-present .(How? Usually by checking specific memory location, registers, or certain conditions in the system.) Most of the time that flag / indicator or binary indicator is set to 0 or 1. These flags can be set in the process environment block (PEB) or in the thread environment block (TEB). If you’re wondering: the PEB is a structure that contains information about the process, such as the process ID, the base address of the process, and the path of the executable. The TEB is a structure that contains information about the thread, such as the thread ID, the stack base, and the stack limit.
NtGLobalFlag : The NtGlobalFlag is a system-wide flag stored in the PEB (Process Environment Block) structure.
It is used to indicate whether a process is being debugged or not.
The value of it is 0 by default, but it can be changed to some degree under process control.
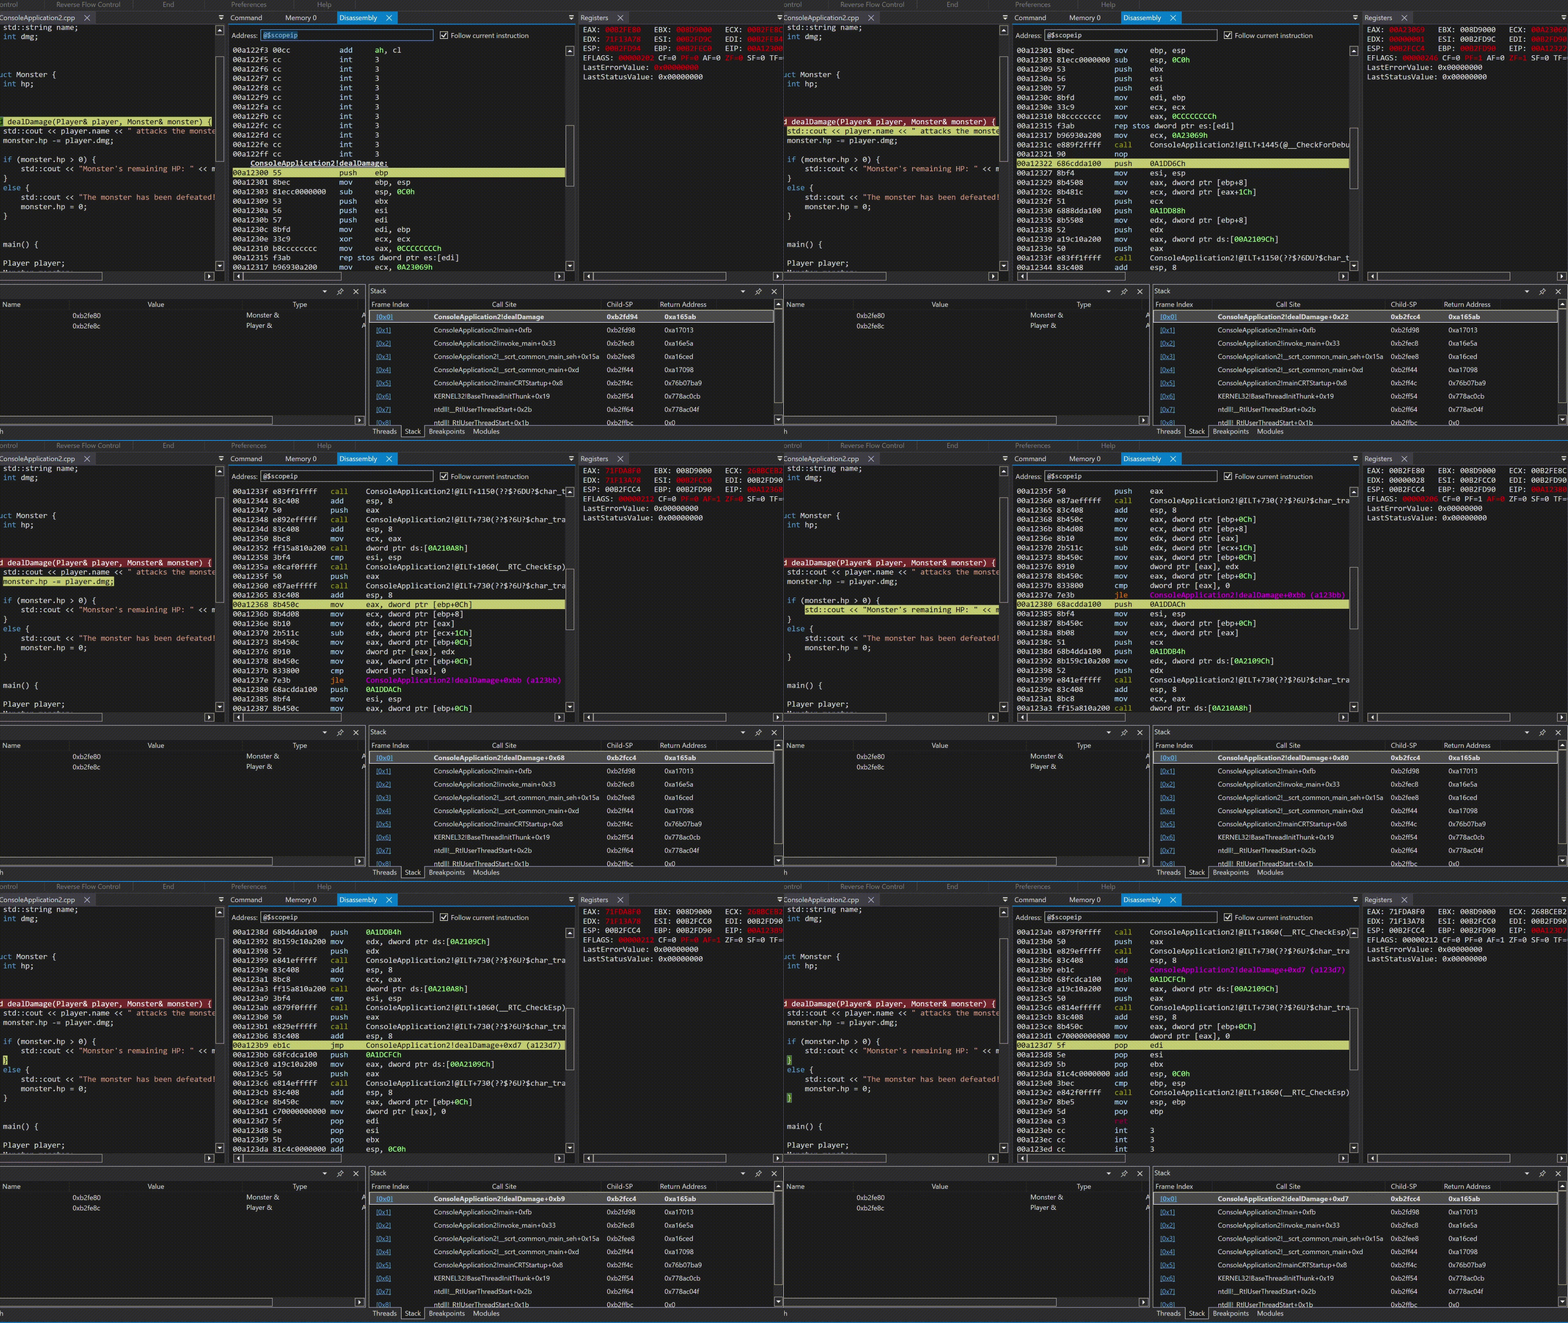
So, you may ask how does the step by step debug helps? Now let’s analyse a simple example.

I’m not going to stop and talk about what is happening there but in simple words, the debugger is stepping through the code, and the program is executing the instructions one by one. This is how you can understand the flow of the program and how it interacts with the memory and registers.
Environment and System-Level Checks
Before we dive into the code, let’s talk about some environment and system-level checks that can be used to detect a debugger.
Debugger-Specific Environment Variables
Some debuggers set environment variables to indicate that a debugger is attached.
The program can query the system for the presence of these variables to determine if a debugger is attached.
Checking for Debugger Processes
Another way to detect a debugger is by checking for the presence of debugger processes. This can be done by enumerating the running processes and checking for the presence of known debuggers, such as OllyDbg, x64dbg, or IDA Pro.
- Enumerate processes using
CreateToolhelp32Snapshotand check for known debugger process names.
Detecting Debugger-Specific System Calls
Some debuggers use specific system calls or insert their own hooks. By checking or analyzing the behavior of these system calls, we can detect the presence of a debugger.
Functions that may help:
NtQueryInformationProcess
System Calls:
NtCreateThreadNtReadVirtualMemoryNtWriteVirtualMemory
Detection Techniques:

IsDebuggerPresent
One of the easiest ways to detect a debugger is by using the IsDebuggerPresent function. This function checks whether the calling process is being debugged by a user-mode debugger. If the function returns a non-zero value, the process is being debugged. Otherwise, the process is not being debugged.
if (IsDebuggerPresent())
    return -1;
At a lower level, specifically in assembly language, the code would appear as follows:
   call IsDebuggerPresent
   test eax, eax
   jne debugger_detected

debugger_detected:
    mov eax, -1
    ret
What’s happening here? The code is calling kernel32!IsDebuggerPresent, which generally checks the BeingDebugged flag in the PEB (Process Environment Block). If the flag is set, it jumps to the debugger_detected label, sets eax to -1, and returns. Otherwise, it continues execution.”
CheckRemoteDebuggerPresent
Another way to detect a debugger is by using CheckRemoteDebuggerPresent(), which checks whether a process is being debugged by a remote debugger. This function takes a process handle as input and returns a non-zero value if the process is being debugged. Otherwise, it returns zero.
BOOL ProcessIsBeingDebugged;
if(CheckRemoteDebuggerPresent(GetCurrentProcess(), &ProcessIsBeingDebugged))
{
    if(ProcessIsBeingDebugged)
    {
		return -1;
    }
}
At a lower level, the code would look like this:
	lea eax, [ProcessIsBeingDebugged]
	push eax
	push -1; ;GetCurrentProcess()
	;or mov     edi, esp
	call CheckRemoteDebuggerPresent
	cmp [ProcessIsBeingDebugged], 1
	jz debugger_detected

    debugger_detected:
        push -1
        call ExitProcess
What about x86-64??
    lea rdx, [ProcessIsBeingDebugged]
    mov rcx, -1
    call CheckRemoteDebuggerPresent
    cmp [ProcessIsBeingDebugged], 1
    jz debugger_detected

    debugger_detected:
        mov eax, -1
        call ExitProcess
What can we observe here? The code is invoking kernel32!CheckRemoteDebuggerPresent, a function that determines if the process is being debugged by a remote debugger.
This function is also part of Windows API (the same as IsDebuggerPresent). If the process is being debugged, it triggers the debugger_detected label, sets eax to -1, and exits the process.
Most of the time the logic behind these functions is the same, but the implementation may differ by that i mean the logic of the code.
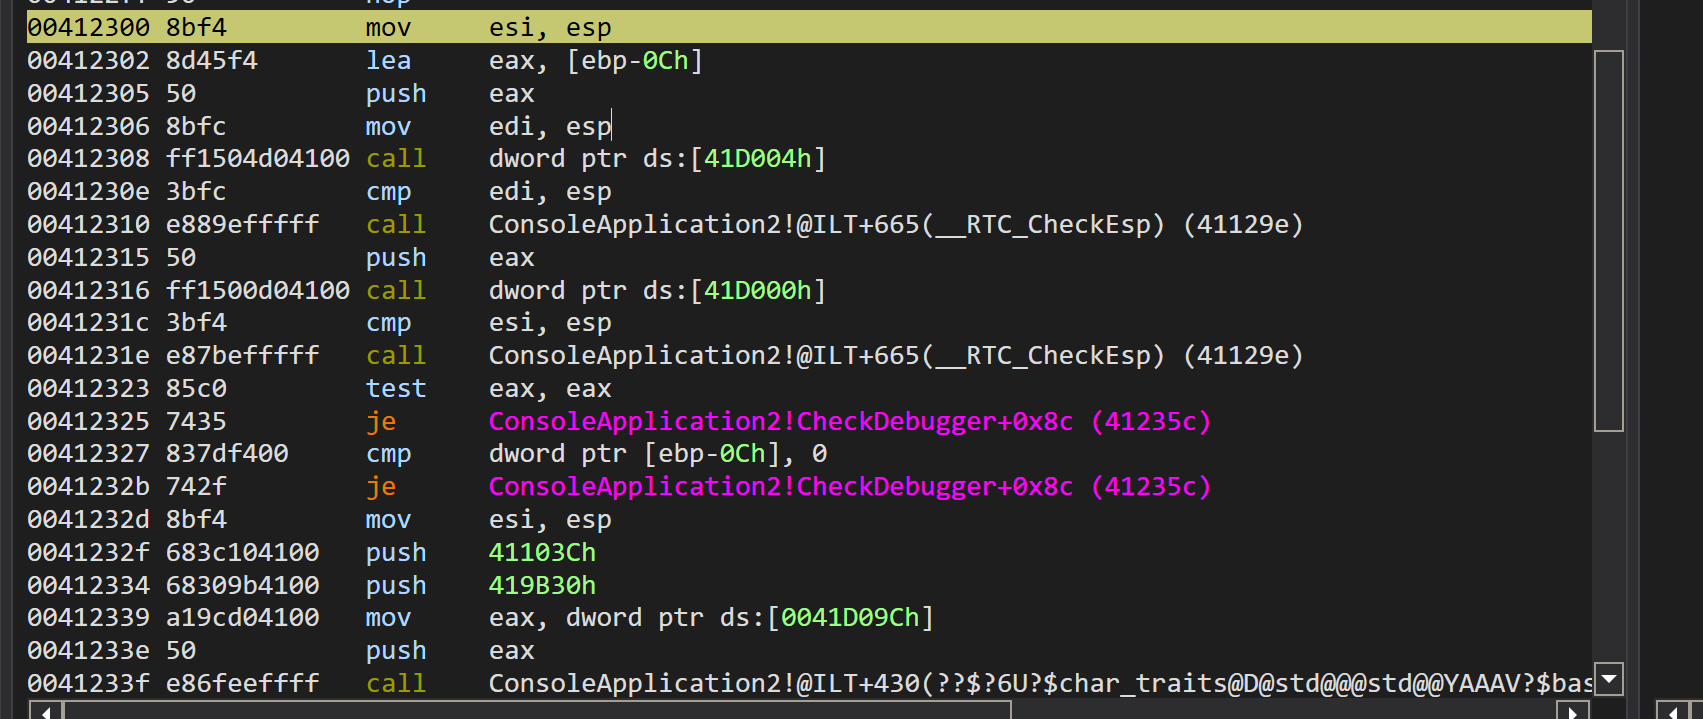
Before moving to the next code the code in our case is used as an example to show how the function works.

As you an see we just can assume that the process is being debugged, based on the references.
Now that you understand that we use references to understand how the function works, let’s move to the next function.
PEB!BeingDebugged Flag
We talked about IsDebuggerPresent and CheckRemoteDebuggerPresent, but what about the PEB (Process Environment Block)?
The PEB is a structure that contains information about the process, such as the process ID, the base address of the process, and the path of the executable.
The PEB also contains a flag called BeingDebugged that indicates whether the process is being debugged. If the flag is set, the process is being debugged. Otherwise, the process is not being debugged.
By using this method we dont need to call any function. We can directly check the flag in the PEB.
  #ifdef _WIN64
 	PEB pPEB = (PPEB)__readgsqword(0x30);
 #else
 	PPEB pPEB = (PPEB)__readfsdword(0x60);
 #endif
  if (pPEB->BeingDebugged)
     {
         return -1;
     }
32-bit
   mov eax, fs:[30h]
   cmp bye ptr [eax+2], 0
   jne debugger_detected
64-bit
     mov rax, gs:[60h]
     cmp byte ptr [rax+2], 0
     jne debugger_detected
In both cases, the PEB address is fetched from the FS or GS segment, depending on the architecture:
-
For 32-bit, the PEB address is stored at offset
0x30in the FS segment. -
For 64-bit, the PEB address is stored at offset
0x60in the GS segment. -
FS is used to store the base address of the Process Environment Block (PEB) in 32-bit Windows.
-
GS is used to store the base address of the PEB in 64-bit Windows.
The BeingDebugged flag is located at offset 0x2 in the PEB. If this flag is set (non-zero), it indicates that the process is being debugged. If the flag is not set (zero), the process is not being debugged.
Bypassing Anti-Debugging Techniques
We took a look at some of the most common anti-debugging techniques, but how can we bypass them? Let’s take IsDebuggerPresent as an example.
 call IsDebuggerPresent
  test eax, eax
  jne debugger_detected

  ...
  [code]
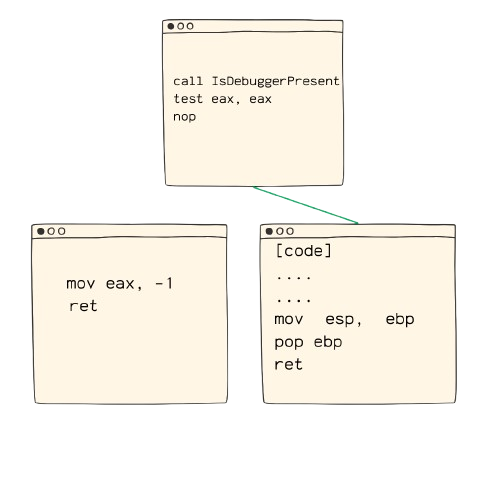
We will analyse the code again and see how can we “bypass” it.
- The code calls
IsDebuggerPresentto check if the process is being debugged. - It tests the return value of
IsDebuggerPresentby performing a bitwise AND operation with itself. - If the result is non-zero, it jumps to the `debugger_detected
Now , IsDebuggerPresent is one of the easiest anti-debugging techniques to bypass.
Why? because we can patch the jump instruction to skip the debugger_detected label.
   call IsDebuggerPresent
   test eax, eax
   nop

   ...
   [code]
As you can observe the flow of the code, the jne instruction is replaced with a nop instruction.
Therefore the program will continue executing the code after the IsDebuggerPresent call, regardless of the return value.
Final Thoughts
You might be wondering, “What about the other functions?” It’s important to recognize that not all anti-debugging mechanisms are implemented in the same way. For instance, while an if statement can often be bypassed by patching the jump instruction, a while statement presents a different challenge. This is why I’m preparing a new blog post focused on bypassing various anti-debugging techniques (though not all of them). The examples I’ll be discussing will be drawn from PicoCTF and Crackmes.
P.S: I’m not going to post only about bypassing anti-debugging techniques, but also about how to implement them.

Resources:
Would you like to support me?
If you find my content helpful and would like to support my work, consider visiting my Patreon page.
Your support means the world to me and helps keep this work going!

